
Exam Overview
| Exam Code | TDS-C01 |
| Exam Name | Tableau Desktop Specialist Exam |
| Vendor | Tableau |
| Total Questions | 317 |
| Last Updated | 26-Oct, 2026 |
Why CertsPoint?
- Latest & Verified Questions
- Detailed Explanations
- Regular Updates
- Full-Length Practice Tests
- Boost Your Exam Confidence
PDF Study Materials
Downloadable guides and resources
Practice Tests
Full-length tests with real exam experience
Progress Tracking
Monitor your performance and improvement
Study Anywhere
Access on desktop, tablet, and mobile
Secure Payment
Privacy Protected
Money Back Guarantee
Free TDS-C01 Practice Questions
Explore 4 free practice questions for the Tableau TDS-C01 exam and review the answers and explanations to support your preparation.
-
Question 1
Single answerWhich of the following would you use to connect to multiple tables in a single data source at once?
-
Option A:Correct
A Blend
-
Option B:Correct
A Hierarchy
-
Option C:Correct
A Set
-
Option D:Correct
A Join
Show Answer & Explanation Hide Answer & Explanation
Correct Answer: D
Explanation
The data that you analyze in Tableau is often made up of a collection of tables that are related by
specific fields (that is, columns). Joining is a method for combining data on based on those common
fields. The result of combining data using a join is a virtual table that is typically extended
horizontally by adding columns of data.
For example, consider the following two tables originating from a single data source: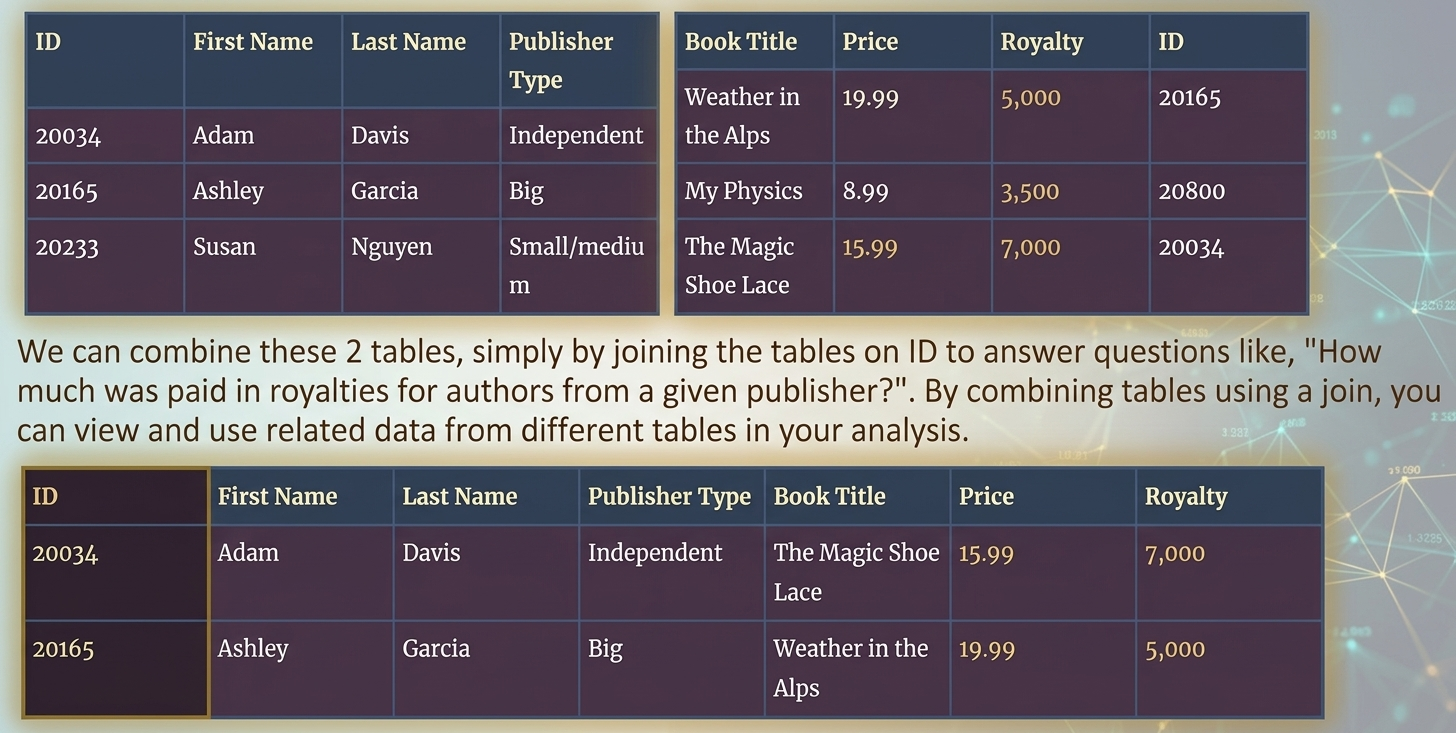
-
-
Question 2
Single answerBy definition, Tableau displays measures over time as a
-
Option A:Correct
Packed Bubble
-
Option B:Correct
Bar
-
Option C:Correct
Stacked Bar
-
Option D:Correct
Line
Show Answer & Explanation Hide Answer & Explanation
Correct Answer: D
Explanation
Line charts connect individual data points in a view. They provide a simple way to visualize a
sequence of values and are useful when you want to see trends over time, or to forecast future
values.
Please refer to the images below: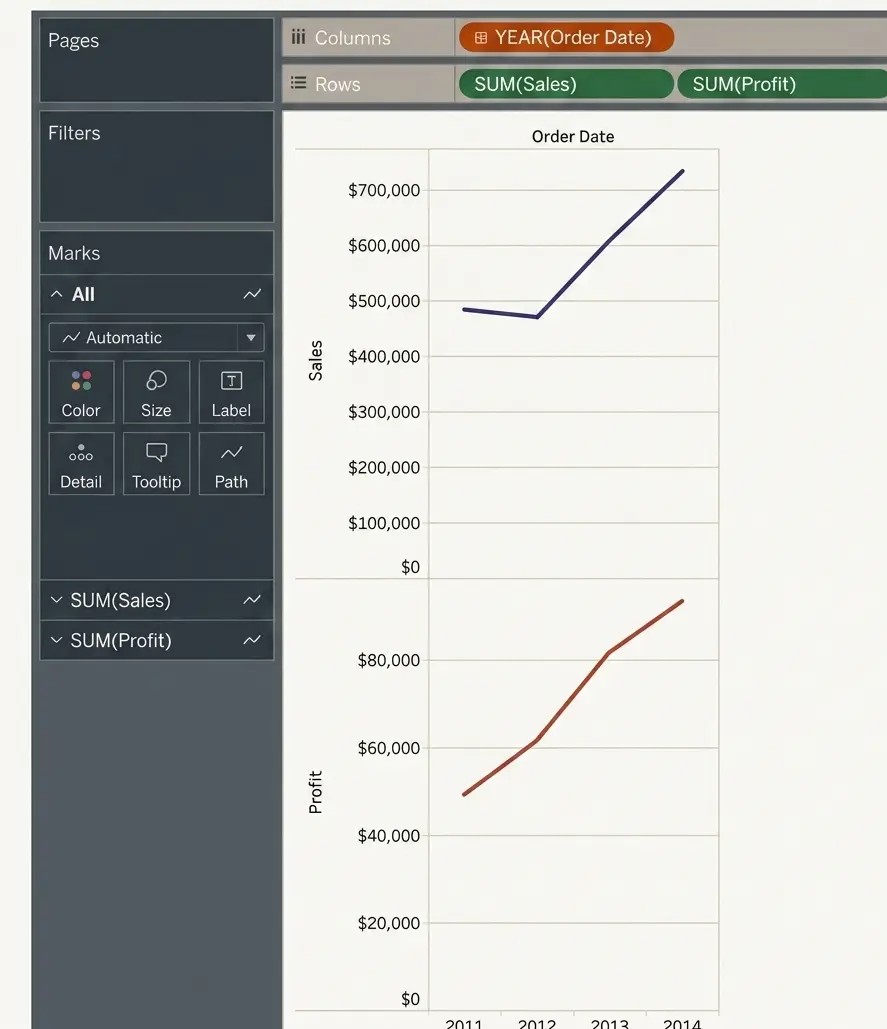
-
-
Question 3
Single answerIs it possible to use measures in the same view multiple times (e.g. SUM of the measure and AVG of
the measure)?-
Option A:Correct
Yes
-
Option B:Correct
No
Show Answer & Explanation Hide Answer & Explanation
Correct Answer: A
Explanation
Yes, it is very much possible to use measures in the same view multiple times. For example, refer to
the image below: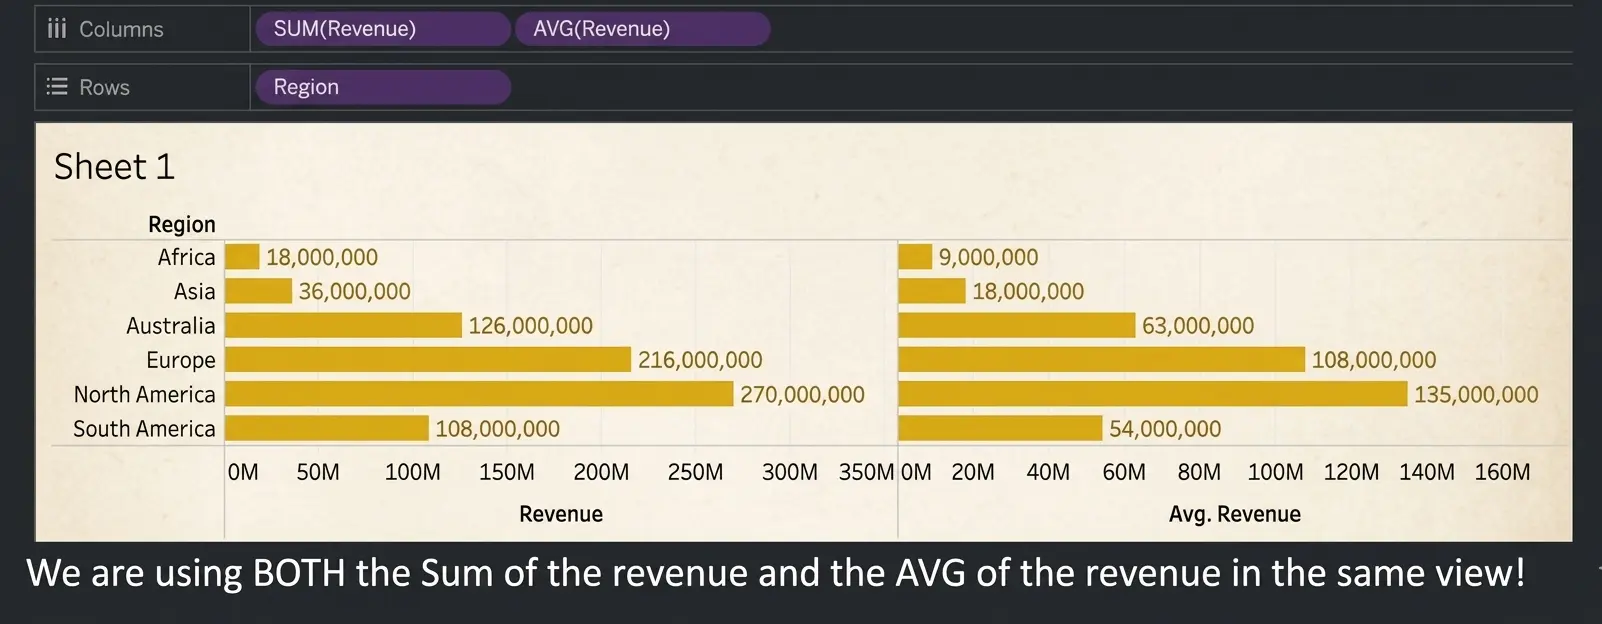
-
-
Question 4
True / FalseTrue or False: The Highlighting action can be disabled for the entire workbook.
-
Option A: TrueCorrect
-
Option B: FalseCorrect
Show Answer & Explanation Hide Answer & Explanation
Correct Answer: A
Explanation
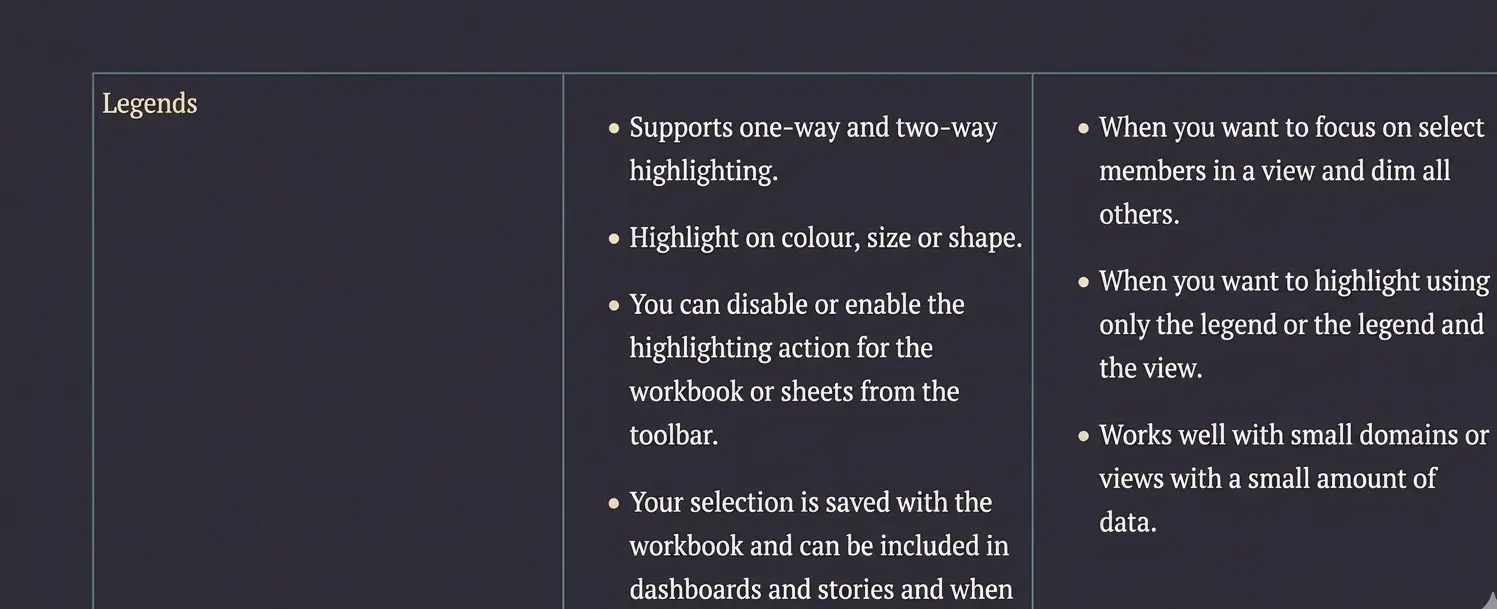
Yes, it is possible to disable highlighting for the entire workbook.
-