
Exam Overview
| Exam Code | Applied Algebra |
| Exam Name | WGU Applied Algebra FXO2 PFXP C957 |
| Vendor | WGU |
| Total Questions | 0 |
| Last Updated | 26-Oct, 2026 |
Why CertsPoint?
- Latest & Verified Questions
- Detailed Explanations
- Regular Updates
- Full-Length Practice Tests
- Boost Your Exam Confidence
PDF Study Materials
Downloadable guides and resources
Practice Tests
Full-length tests with real exam experience
Progress Tracking
Monitor your performance and improvement
Study Anywhere
Access on desktop, tablet, and mobile
Secure Payment
Privacy Protected
Money Back Guarantee
Free Applied Algebra Practice Questions
Explore 8 free practice questions for the WGU Applied Algebra exam and review the answers and explanations to support your preparation.
-
Question 1
Single answer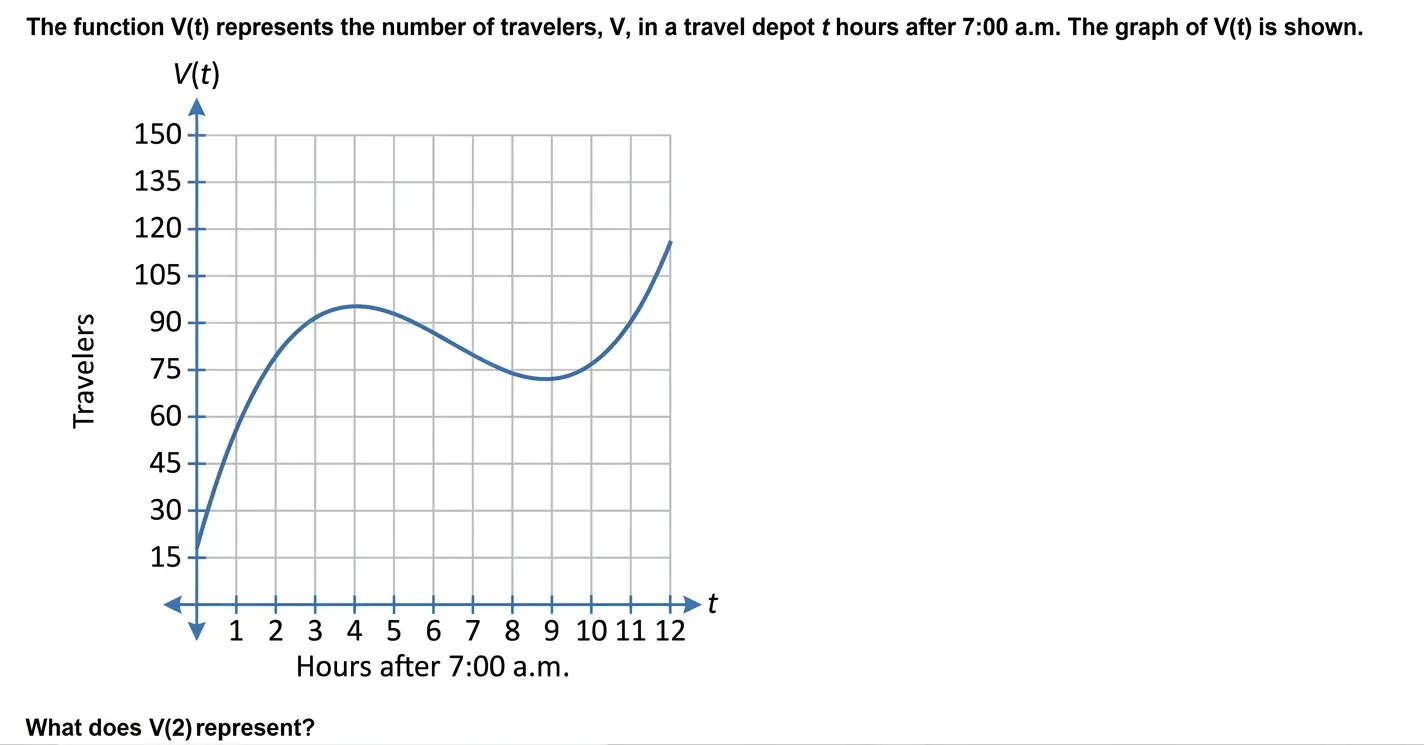
-
Option A:Correct
2 Hours
-
Option B:Correct
2 travellers
-
Option C:Correct
79.2 Hours
-
Option D:Correct
79.2 travellers
Show Answer & Explanation Hide Answer & Explanation
Correct Answer: D
Explanation
he function V(t)represents the number of travelers in the travel depot.
The input trepresents:
" hours after 7:00 a.m. "
The output V(t)represents:
" number of travelers "
So V(2)means the number of travelers in the depot:
2 " hours after 7:00 a.m. "
From the graph, when:
t=2
the value of V(t)is approximately:
79.2
Since V(t)measures travelers, not hours, V(2)represents:
79.2 " travelers "
Therefore, the correct answer is:
▭ ( " D " ) -
-
Question 2
Single answer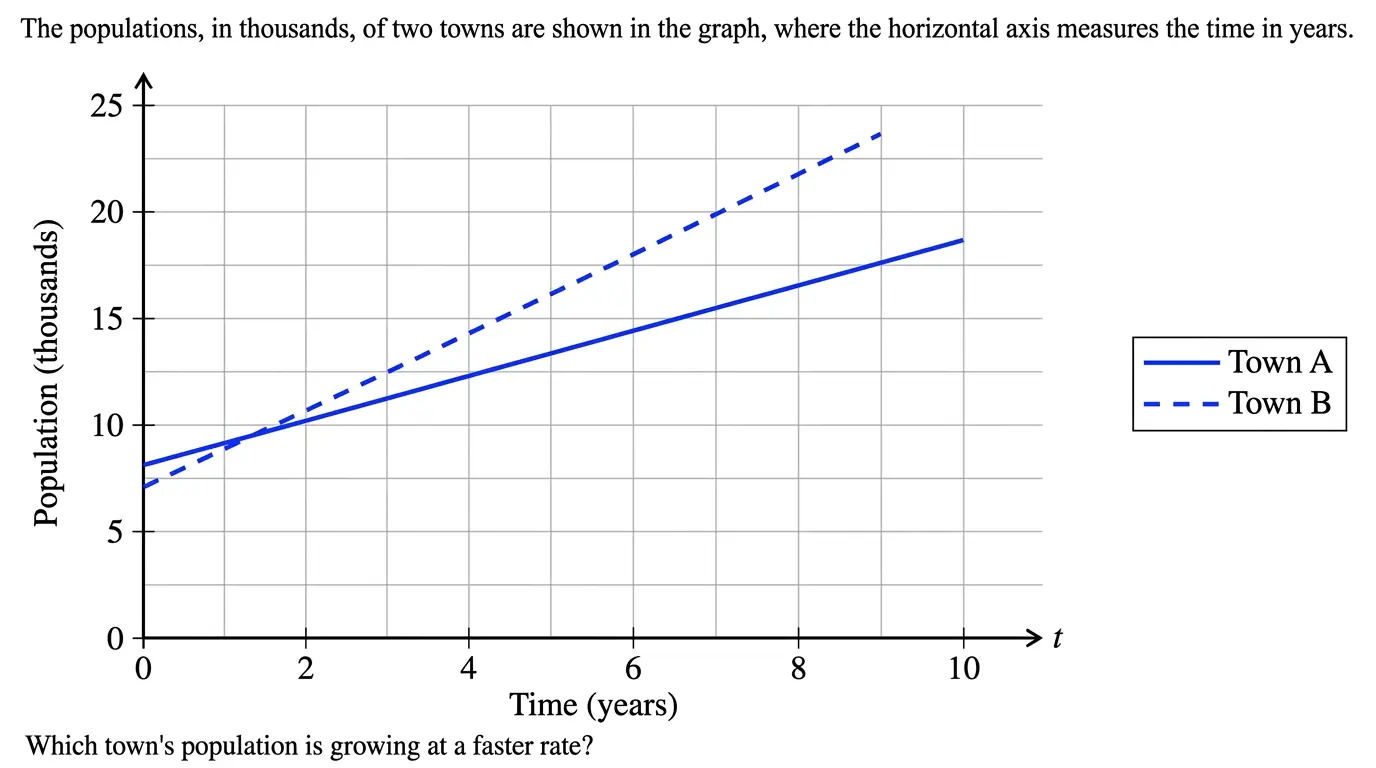
-
Option A:Correct
Town B, because 1.6 > 0.9
-
Option B:Correct
Town A, because 8.0 > 6.5
-
Option C:Correct
Town B, because 8.0 > 6.5
-
Option D:Correct
Town A, because 1.6 > 0.9
Show Answer & Explanation Hide Answer & Explanation
Correct Answer: A
Explanation
he graph compares the populations of two towns over time.
The horizontal axis represents:
" Time in years "
The vertical axis represents:
" Population in thousands "
The graph shows:
Town A as the solid blue line.
Town B as the dashed blue line.
To determine which town’s population is growing faster, we compare the slopes of the two lines.
In Applied Algebra, the slope of a line represents the rate of change:
" slope " = " change in population " / " change in time "
From the graph:
" Town A grows at about " 0.9 " thousand people per year "
" Town B grows at about " 1.6 " thousand people per year "
Now compare the growth rates:
1.6 > 0.9
So Town B’s population is growing at a faster rate.
The values 8.0and 6.5describe starting populations, not growth rates. Since the question asks about growing at a faster rate, we must compare the slopes. -
-
Question 3
Single answer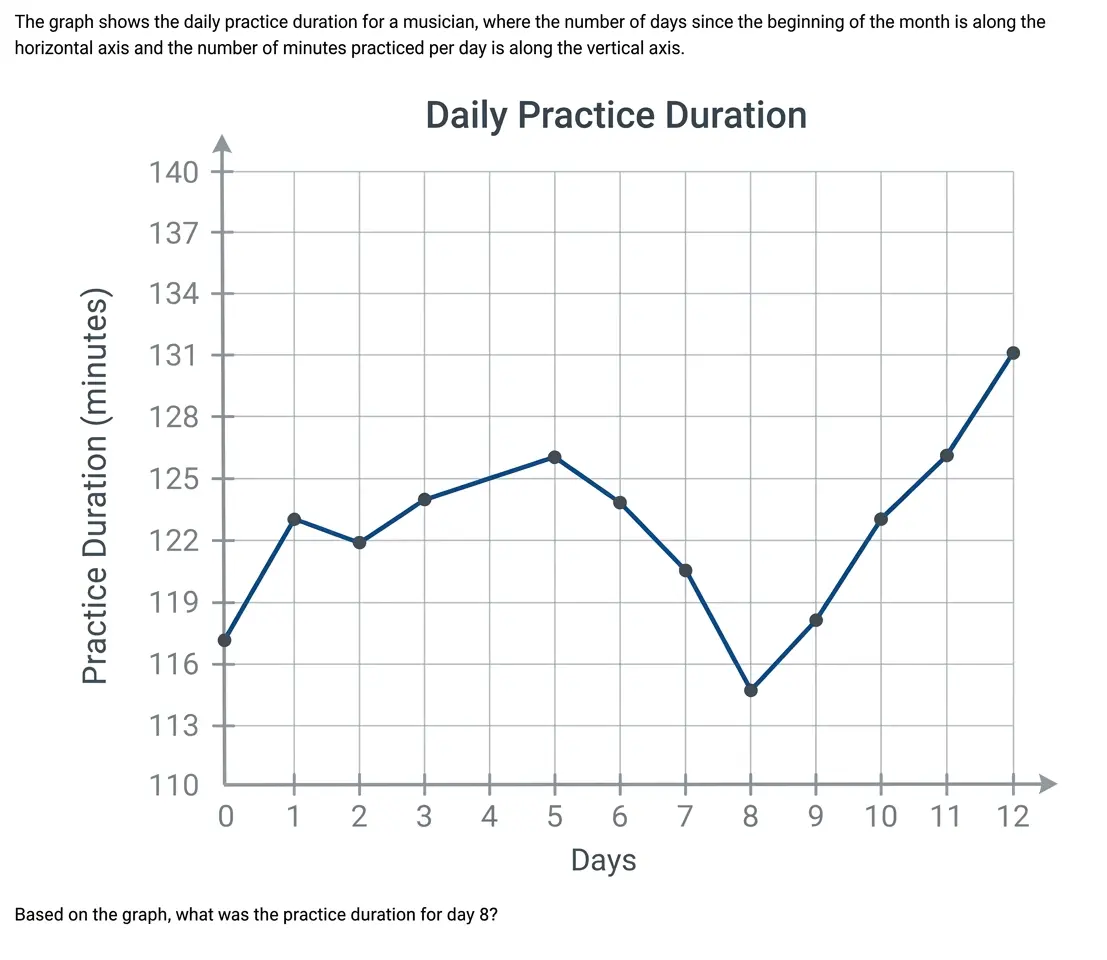
-
Option A:Correct
115 Minutes
-
Option B:Correct
117 Minutes
-
Option C:Correct
118 Minutes
-
Option D:Correct
120 Minutes
Show Answer & Explanation Hide Answer & Explanation
Correct Answer: A
Explanation
This question asks us to interpret a value from a graph.
The horizontal axis represents:
Days
The vertical axis represents:
Practice duration in minutes
We need to find the practice duration on day 8.
To do this:
Locate 8 on the horizontal axis.
Move vertically until you reach the blue graph.
Read the corresponding value on the vertical axis.
From the graph, when:
x=8
the blue graph is at:
y=115
So the musician practiced for:
115 minutes -
-
Question 4
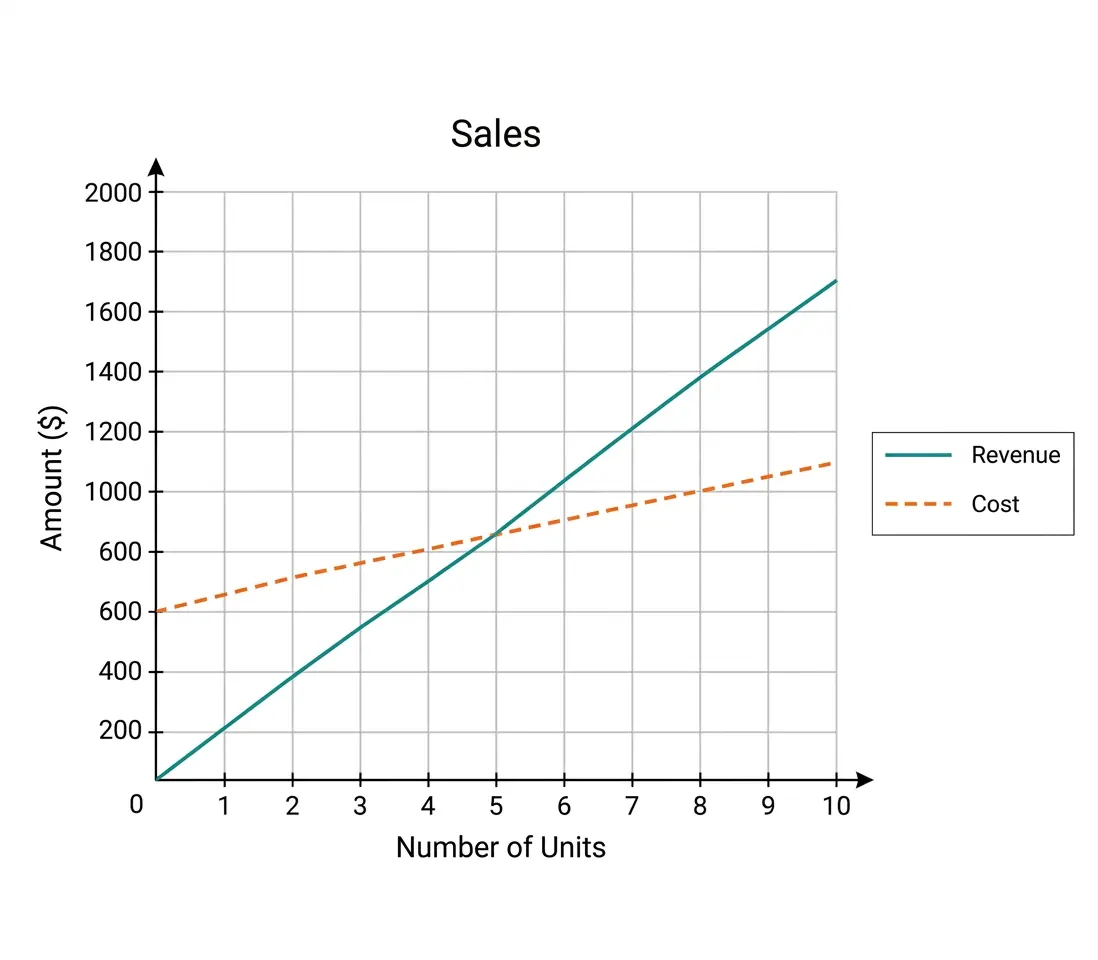
Single answerThe graph shows the functions that model the cost and revenue. How many down quilts need to sell to break even/start making a profit?
-
Option A:Correct
2
-
Option B:Correct
6
-
Option C:Correct
8
-
Option D:Correct
10
Show Answer & Explanation Hide Answer & Explanation
Correct Answer: B
Explanation
This question asks us to interpret a graph showing cost and revenue. In Applied Algebra, the break-even point is where
On a graph, this happens where the revenue line and the cost line intersect. From the graph: The solid blue line represents revenue. The dashed blue line represents cost. The break-even point occurs where these two lines cross. Looking carefully at the graph, the two lines intersect at approximately: The horizontal axis represents the number of units, meaning the number of down quilts sold. So the person needs to sell about: to break even. After selling more than 6 quilts, the revenue line is above the cost line, meaning the person begins making a profit. -
-
Question 5
Single answerThe number of property sales in a region this year is expected to be 6 less than the number of property sales in the region last year. The function represents the number of property sales this year, where represents the number of properties sold last year. Which notation represents the number of property sales this year, given that the number of properties sold last year was 330?
-
Option A:Correct
H(330)=324
-
Option B:Correct
H(324)=330
-
Option C:Correct
H(330)=336
-
Option D:Correct
H(336)=330
Show Answer & Explanation Hide Answer & Explanation
Correct Answer: A
Explanation
We are told that this year’s number of property sales is 6 less than last year’s number of property sales. Let: and
Since this year’s sales are 6 less than last year’s sales, the function rule is: The question says that the number of properties sold last year was: Substitute into the function: So the notation that correctly represents the number of property sales this year is: This means: if 330 properties were sold last year, then 324 properties are expected to be sold this year. -
-
Question 6
Single answerThe graph shows the daily practice duration for a musician, where the number of days since the beginning of the month is along the horizontal axis and the number of minutes practiced per day is along the vertical axis
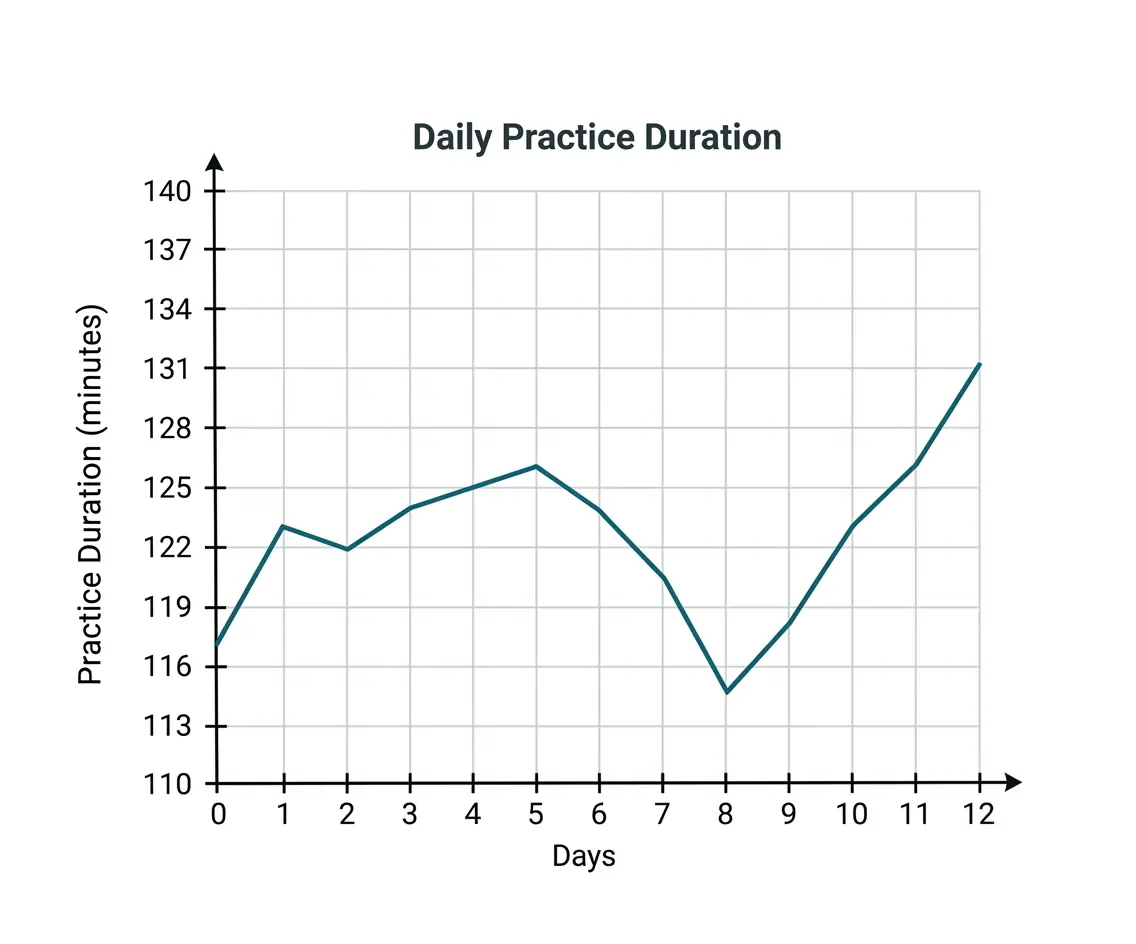
Based on the graph, what was the practice duration for day 8?
-
Option A:Correct
115 minutes
-
Option B:Correct
117 minutes
-
Option C:Correct
118 minutes
-
Option D:Correct
120 minutes
Show Answer & Explanation Hide Answer & Explanation
Correct Answer: A
Explanation
This question asks us to interpret a value from a graph. The horizontal axis represents: Days The vertical axis represents: Practice duration in minutes We need to find the practice duration on day 8. To do this: Locate 8 on the horizontal axis. Move vertically until you reach the blue graph. Read the corresponding value on the vertical axis. From the graph, when: x=8 the blue graph is at: y=115 So the musician practiced for: 115 minutes
-
-
Question 7
Single answerA vehicle is traveling away from a town at a fixed rate. After 1 hours, the vehicle is 200 miles from the town. After 4 hours, the vehicle is 395 miles from the town. Which function represents the distance, , between the vehicle and the town after hours?
-
Option A:Correct
d(t)=65t
-
Option B:Correct
d(t)=135t
-
Option C:Correct
d(t)=135t+65
-
Option D:Correct
d(t)=65t+135
Show Answer & Explanation Hide Answer & Explanation
Correct Answer: D
Explanation
Because the vehicle is traveling away from the town at a fixed rate, the distance can be modeled by a linear function:
where: and We are given two points: and These mean: After hour, the vehicle is miles away. After hours, the vehicle is miles away. First, find the rate of change: So the vehicle is moving away from the town at a rate of: Now the function has the form: Use the point to find : Therefore, the function is: Check using : -
-
Question 8
Single answerThe number of people auditioning for a game show is expected to be 4 times the number of people who auditioned last year. The function A(t) can be used to model the situation, where t represents the number of people who auditioned last year and A represents the number of people expected to audition this year. Which quantity represents the number of people expected to audition this year, given that 330 people auditioned last year?
-
Option A:Correct
A(1,320)=330
-
Option B:Correct
A(330)=1,320
-
Option C:Correct
A(330)=82
-
Option D:Correct
A(82)=330
Show Answer & Explanation Hide Answer & Explanation
Correct Answer: B
Explanation
We are told that the number of people expected to audition this year is 4 times the number of people who auditioned last year.
Let: t=number of people who auditioned last year and A(t)=number of people expected to audition this year Since this year’s number is 4 times last year’s number, the function is: A(t)=4t The question says that 330 people auditioned last year, so: t=330 Now substitute 330 into the function: A(330)=4(330) A(330)=1320 So, the correct function notation is: A(330)=1,320 This means: when 330 people auditioned last year, 1,320 people are expected to audition this year. -